


Pfizer Vaccine Efficacy & Confidence Interval
For participants 6-23 Months of Age and 2 to <5 Years of Age

Let’s take a look to the FDA Briefing Document - EUA amendment request for Pfizer-BioNTech COVID-19 Vaccine for use in children 6 months through 4 years of age at Page 39 (Ref. 1).
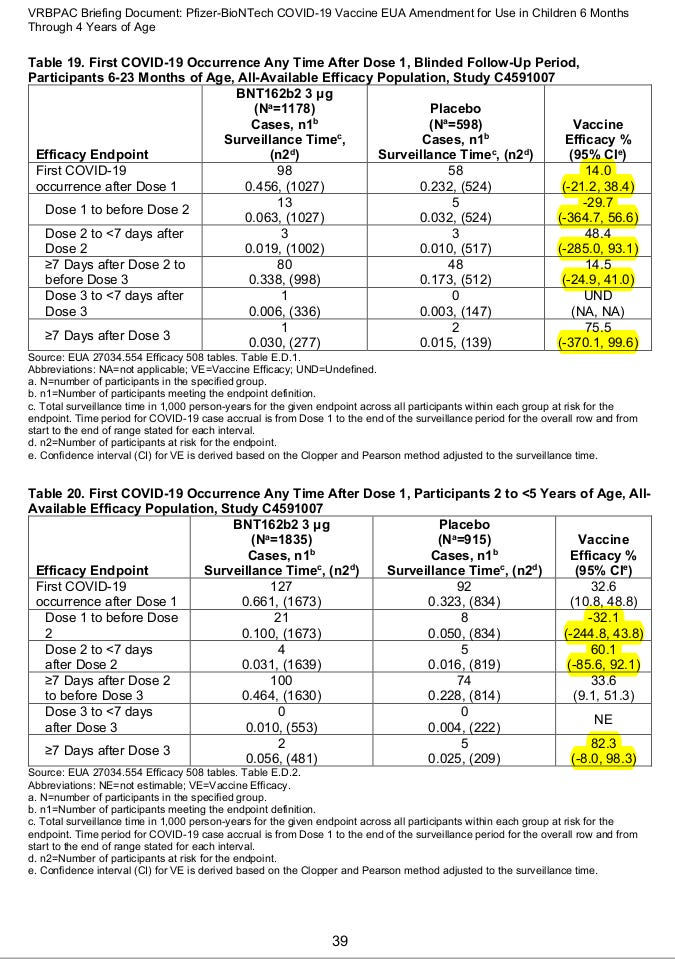
The (95% CI) indicates a 95% chance that the true value of your estimate, in this case the Vaccine Efficacy (VE), is within the values of your Confidence Interval (CI). Therefore it may seem very peculiar to some, as it is to me, to see a vaccine efficacy like the one we observe after Dose 3 in participants 6-23 Months of Age:
VE = 75.5% (95% CI: -370.1, 99.6)
In fact, given the way in which the VE is defined (Refs. 2-5), you can only interpret a Vaccine Efficacy in the interval [0%, 100%].
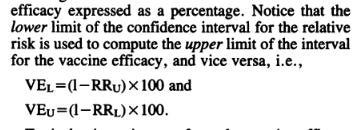
VE = (1-RR) * 100; where RR = [a/(a+b)]/[c/(c+d)];
From (Ref. 4):
For negative efficacy you would use RR* = [c/(c+d)]/ [a/(a+b)]. For instance in Table 19, in the Dose 1 to before Dose 2, we observe:
VE = (1-(13/1027)/(5/524))*100 = -32.7%, [NOTE: Their value of -29.7% is probably a consequence of some participant exclusion criteria not indicated in their report (Ref. 5).]
However if we want to obtain the real negative Vaccine Efficacy (VE*), we would use RR*:
VE* = (1-(5/524)/(13/1027))*100 = 24.6%;
Hence, those negative VE values are physically nonsensical. What do they mean then? You can follow an alternative discussion on the same topic in (Ref. 5).
Here you have a clue from that report:
“if I say the vaccine efficacy is 83% with a confidence interval of 1% – 99%, then a look at that huge confidence interval tells you the 83% point estimate is worthless: it could be almost anything!”
We will elaborate on that in the next section.
CONFIDENCE INTERVAL:
For a more accurate computation of the confidence interval follow (Ref. 2). Their estimates are very close to the values obtained by Pfizer. For simplicity we will follow (Refs. 3-4)

Via these equations we obtained the following values from the data shown in Table 19-20 of the Pfizer report (Ref. 1):

As we can see, our values for the VE are pretty much the same as the ones published by Pfizer and the lower and upper limits are more or less in the same rage. Remember that we are using an approximation and our intention is not to exactly reproduce their values, but to have a better understanding of their significance.
Now let’s begin our Numerical Experiment:
1st) What would be a good result in your vaccine clinical trial?

Here is an example from (Ref. 3) based on the initial clinical trials for Pfizer, VE = 90.7% (95% CI: 80.8, 95.5).
According to (Ref. 2) their standards back then were:
“According to the FDA issued guidance, the vaccine efficacy rate should be at least
50% to be considered a success, although the lower bound of the confidence
interval can be as low as 30% (FDA 2020a), another reminder that confidence
intervals are crucial. To ensure public trust, Pfizer, Moderna, and AstraZeneca
agreed to make their full study protocols publicly available.”
Notice that they required a lower limit for the CI equal or above 30%,
In our terminology: VE_L ≥ 30. Therefore this first example is within the range of efficacy that is required and the confidence interval is very narrow [80.8, 95.5], hence the true estimate is not all over the place, which is what you want.
2nd) Let’s use now a hypothetical trial and let’s analyze where you can say that your result is acceptable. The following table goes from very bad to acceptable according to the previously stated FDA standards (VE ≥ 50; VE_L ≥ 30) :
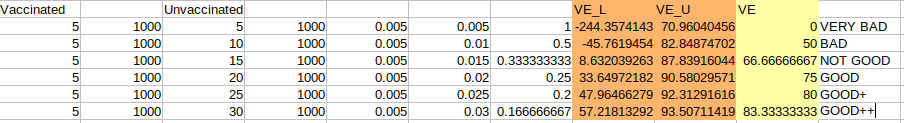
We have 1000 participant in each arm of the trial and as we can see we go from 0% VE to 83.3% VE by gradually increasing the number of cases found in the control group. Now we are in a position in which we can start to clarify the meaning of those negative VE values in the confidence interval.
If we take a look to the second row we have VE = 50% (95% CI: -45.8, 82.9), which if we do not pay attention to the Confidence Interval would be an acceptable result, not the best, but it would be acceptable. The negative range (-45.8) however is indicating that there is not enough difference between the groups for it to be a statistically significant result. There is too much uncertainty. In other words, you have low sample counts. The result start to be acceptable at VE = 66.7% (95% CI: 8.6, 87.8), however your estimate is all over the place, as we said before, “it could be almost anything”, therefore NOT GOOD. I think you get the idea by now!
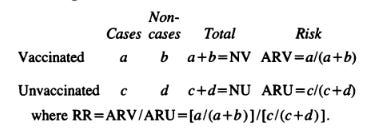
3rd) Now let’s go back again to the Pfizer clinical trial and see how much we have to improve their results after Dose 3 for them to be acceptable. Remember that the FDA authorized this products for EUA under the premise of having a signal after Dose 3 even when Doses 1-2 are doing nothing. Well… Is Dose 3 really doing something? Let’s see:
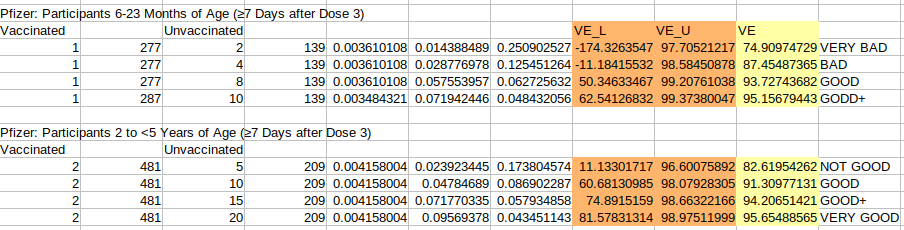
To me it seems that they do not meet the FDA standards at all. In the case of 6-23 Months of Age you have no evidence of efficacy at all and in the case of 2 to <5 Years of Age you still have a Confidence Interval (11.1%, 96.6%) all over the place, your VE could be almost anything and your result is clearly below what is required.
FINAL NOTE (IMPORTANT): Notice how little do I have to “trick” the data for “my vaccines” to be good enough. In the 6-23 Months of Age, I would have to add just 6 more cases to the control group (just 6 more positive PCR tests, think about it!). And in the 2 to <5 Years of Age, I would only have to add 5 more cases. That is very very very “tricky” to me, I’ll just say that.
I HOPE YOU ENJOYED THE RIDE!

TAKE CARE READER & SEE YOU NEXT TIME
References:
(1) https://www.fda.gov/media/159195/download
(2) https://digitalcommons.usf.edu/cgi/viewcontent.cgi?article=1390&context=numeracy
(4) https://pubmed.ncbi.nlm.nih.gov/3260147/
(5) https://www.someweekendreading.blog/pfizer-vaccine-efficacy-confidence-intervals/